
The rate of weekly Covid cases per 100,000 people has swelled again for Thanet with the figure now recorded as 411.5 (4 November to 10 November), according to data published by Kent County Council.
The rate is four times that of west Kent’s Tunbridge Wells and has more than doubled from the 200.8 weekly cases per 100,000 people recorded for the week up to November 2.
Today’s (November 14) figures on the government coronavirus dashboard show 80 new cases reported for Thanet (down on 103 yesterday), making a total of 631 cases between November 8-14. This is a rise of 275 (or 77.2%) on the figure for the previous seven days.
The total number of people in Thanet who have had a confirmed positive test result as of November 14 was 2,403.
There were five deaths within 28 days of a positive test for Coronavirus reported for the week to 14 November for Thanet. The total number of people who have died within 28 days of testing positive for Coronavirus as of today was 124. Covid-19 is mentioned on the death certificate but may not be the primary cause of death.
The government dashboard says the seven day rolling rate to November 9 is 383.3 per 100,000 ( a day’s time lag on the figures published by Kent County Council).
The latest R number (the rate an affected person will spread to others) for the healthcare region of South East is estimated at 1.2 to 1.4 with a daily infection growth rate range of +3% to +6% as of 13 November. Ideally the R rate should be at one or below to show a decrease of virus spread.
Across the UK 462 deaths and 26,860 positive tests were reported today.
East Kent Hospitals data
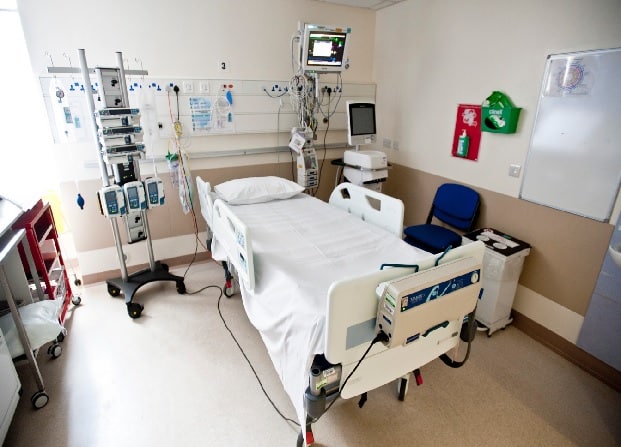
As of November 5, 818 East Kent Hospitals trust beds were occupied and of these 27 were confirmed covid patients beds, up from 3 on October 5
Mechanical ventilation beds occupied 36 – of these 5 are confirmed Covid patients
There was just one admission for a Covid confirmed patient between November 1-4
Six inpatients were diagnosed with Covid November 1-4
There were 8 discharges for Covid confirmed patients November 1-4
From November 1-12 (November 8-12 provisional data) 12 Covid-related deaths have been recorded within East Kent Hospitals (main hospitals Margate, Ashford and Canterbury)
A total of 481 covid related deaths have been recorded at East Kent Hospitals since March 1-November 12.
Data compiled by HSJ says there is a 3.5% Covid patient ratio at East Kent Hospitals, which is among the lowest in the country.
Tier restrictions?
Yesterday Thanet council leader Rick Everitt said the whole community needs to take action now to reduce the spread and lessen the risk of high tier restrictions when the ‘lockdown’ ends on December 2.
He said: “Although we have been in a slightly better position than the national picture, this no longer the case. The fact is that the number of cases in Thanet has risen sharply since mid-October and we need to take action to respond as a community. If the numbers don’t fall we face the threat of continuing restrictions when the national lockdown is reviewed in December, which will have a further effect on everyone’s lives, as well as the local economy.”

Andrew Scott-Clark, Director of Kent Public Health, said there is evidence of more outbreaks in the community. He said: “Cases are rising across every area in Kent and we are seeing more outbreaks in the community – especially Thanet and Swale – and among working age populations.
“Although we are still below the national average as a county, it’s really important that we protect the most at risk people among our older residents and this is important now, before we reach the end of any national restrictions. KCC is working closely with Thanet District Council and partners to manage and respond to the Covid pandemic and we will ensure the public are kept fully informed as plans for the county, post national lockdown, are established.”
Did the tier restrictions work?

Yesterday (November 13) Prof Paul Hunter, Professor in Medicine, The Norwich School of Medicine, University of East Anglia, said the virus appears to be levelling out in areas that had been in high tier restrictions before the national ‘lockdown, But increased gathering in the days between the lockdown announcement and it actually coming into force appear to have caused a rise in infections across other areas in England
He said: “A recent report by ONS (Office of National Statistics) shows that the epidemic was continuing to level out at least in the week up to November 6.
“The modelling based on these data suggest that the incidence of new infections was even declining, albeit slowly. There are still regional variations in trend with the areas of the North West that were generally in tier 3 showing the greatest decline. It is also notable that the most obvious decline was in younger age groups 7 to 24 whilst in older age groups the prevalence was still increasing.
“These results are in line with other sources of data that suggest that the tier system was having a beneficial impact on bringing down the transmission rate of the infection, and it is notable that the region with the greatest number of local authorities in tier 3 (The North West) has seen the most obvious decline in prevalence.
“On November 12 there was a dramatic increase in reports of new COVID infections in England and it looks like this increase was first obvious in samples collected on November 9. We have to be careful about reading too much into a single day’s figures but it has been suggested that the increase was due to increased socialisation in the days before the start of the new lockdown.
“If this increase in the daily reports of new cases continues over the next few days then it is indeed likely that increased socialisation during the five days between the announcement and the eventual lockdown has driven a surge in infections and thereby reduced any benefit from the current lockdown. We will have to wait for the next ONS report to know for certain what has been happening in the past few days.”
Source Science Media Centre
Looking at Covid rates and deprivation
Reasons for growth in areas like Thanet and Swale may be linked to deprivation, both districts have wards that rank in the county and UKs most deprived areas based on factors such as education, income and employment, health and disability, housing, crime and environment.
Thanet ranks as the most deprived local authority in Kent (2019 data) and has the greatest number of neighbourhood areas (known as LSOAs) classed as most deprived, followed by Swale.
However, areas with similarly high deprivation, such as Hastings, recorded a rate per 100,000 of just 61.5 in the seven days rolling to November 9 and 8 deaths within 28 days of a positive covid test up until November 14, according to the government dashboard data. The area has a total of 502 confirmed positive test results as of November 14.
Speaking earlier this year about factors evident in the spread of the virus Prof Dave Gordon, Director of the Bristol Poverty Institute and Director of the Townsend Centre for International Poverty Research, University of Bristol, said deprived areas are shown to be amongst the hardest hit:
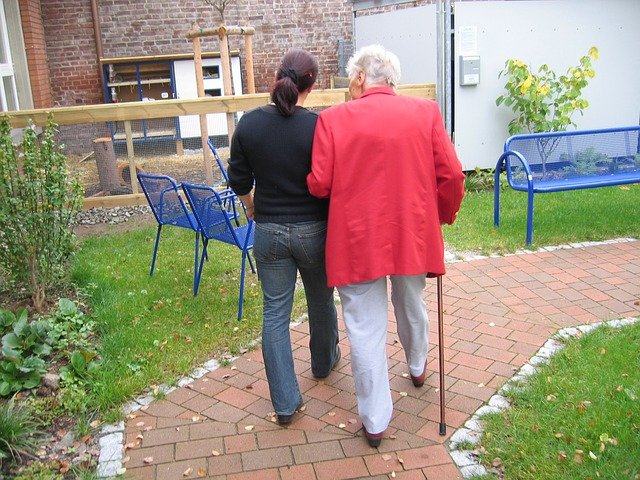
He said: “People in poorer areas are more likely to get a Covid-19 infection. They are more likely to be key workers (for example, care assistants, shop assistants, building workers, bus drivers, delivery drivers, etc) so they are more likely to come into contact with infected people than their peers in richer areas who may be able to work from their homes.
“Many key worker jobs are low paid and therefore these key workers often live in deprived areas. People in deprived areas are more likely to have to rely on public transport than people in richer areas and thus come into contact with infectious people.
“They are also more likely to have worse internet connections and not be able to afford the premium on grocery home delivery services so will need to go out to shop for food more often than people in richer areas.
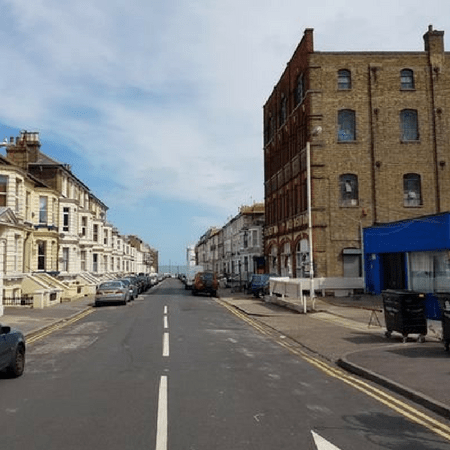
“Deprived areas tend to have higher population densities than richer areas therefore people in these areas are more likely to have contact with an infected person when they leave their homes for exercise, medical care, food shopping, etc. The higher the population density the more difficult maintaining social distancing is likely to be.

“Secondly, people in poor areas who have a Covid-19 infection are more likely to die. There is a higher risk of severe disease and death from a Covid-19 infection if you have underlying health condition such as hypertension, diabetes, cardiovascular disease, chronic respiratory disease and cancer.
“People in deprived areas are more likely to suffer from these particular underlying health conditions than people in richer areas, for a range of reasons, such as greater pollution levels, greater stress levels, greater inflammation levels, greater risk of infections in childhood. The Inverse Care Law unfortunately still affects the NHS in the UK – the quality of health care is inversely related to health need i.e. deprived areas on average have worse health care than richer areas.
“It is very disappointing but not surprising that more people are dying of Covid-19 infections in deprived areas, given the reasons listed above. However, what is a surprise is that the inequality in death rates between richer and poorer areas from Covid-19 are so much greater than deaths from other causes.
“In the most deprived 30% of areas people are more than twice as likely to die from Covid-19 infections compared with people in the richest 10% of areas in both England and in Wales. So far the Public Health response to the pandemic has not targeted or tried to shelter people living in deprived areas – this is clearly needed.”
Source Science Media Centre
District comparison
At a local level there is a disparity between cases in Thanet, with its deprivation ranking, compared to more affluent Tunbridge Wells which does not have any LSOAs within the 10% most deprived. Tunbridge Wells recorded 18 new confirmed positive tests today making a total of 1,119. The total number of people who have died within 28 days of testing positive for Coronavirus as of 13 November for Tunbridge Wells was 54. Weekly cases per 100,000 for that borough stand at 100.2.
Thanet has two Covid testing centres, a drive in at Manston and a walk/drive in at the car park by Dreamland. The nearest walk/drive through sites to Tunbridge Wells are Rochester, Chatham or Gatwick (excluding mobile testing).
Kent Public Health is working with partners towards a local Test and Trace system which will be aligned to the current NHS national system and expected to be in place by the end of November.
Kent’s Public Health is also finalising plans and liaising with the Department of Health and Social Care to request supplies of Lateral Flow Devices (rapid testing).
Find more information at www.kent.gov.uk/protectkent “
BAME communities
Dr Navin Kumta, Ashford GP and clinical chair of the CCG, says GPs are working to support patients from Black, Asian and ethnic minorities (BAME) backgrounds and others at high risk from Covid-19:
He said: “People from Black, Asian and ethnic minorities, and those in areas of deprivation, are more likely to be affected by Covd-19 than others. The risks increase more with age, with long term conditions, with jobs that have lots of contact with others, and with being overweight.”
GP surgeries across Kent and Medway are contacting their patients who are most at risk from Covid-19 to provide advice and to review their long term conditions.
Dr Kumta added: “Conditions like diabetes and high blood pressure add to the risks. One of the most important things you can do to be fit to fight Covid is to make sure any long term conditions are under control. There are often simple things your GP can do to help.
“If you get a letter, text or call please don’t ignore it. Covid is serious and we can help.”
Weekly cases per 100,000 people
Thanet 411.5
Swale 357.1
England 257.4
Gravesham 256.2
Dartford 254.9
Tonbridge and Malling 178.6
Maidstone 171.1
Canterbury 169.9
Dover 166.0
Sevenoaks 144.9
Folkestone and Hythe 123.0
Ashford 118.5
Tunbridge Wells 100.2
Figures from Kent County Council
*DATA COMES FROM GOVERNMENT’S CORONAVIRUS DASHBOARD AND KENT COUNTY COUNCIL.
Council support
Community Helpline for anyone who needs additional support at this time. The number is 01843 577 330 and the helpline is open from 9am to 5pm Monday to Friday.
Funding for local businesses will open week commencing 23 November www.thanet.gov.uk/business-advice.
There is a Facebook Group to provide local businesses with information, help and support: www.facebook.com/groups/ThanetBusinessSupport

