


Government data shows the rate of positive covid tests per 100,000 in Thanet is falling again although data may be incomplete due to the holiday period.
According to the government covid dashboard the Thanet figure is 565.8 per 100,000 for the seven days to December 23. This is the second lowest rate in Kent and Medway with only Tunbridge Wells having a lower number.
The England average stands at 378.6 per 100,000.
Today (December 28) 71 positive Thanet tests were reported, making 751 in the last seven days, a 9.6% drop on the preceding week. A total of 6387 positive tests have been recorded for Thanet to date.
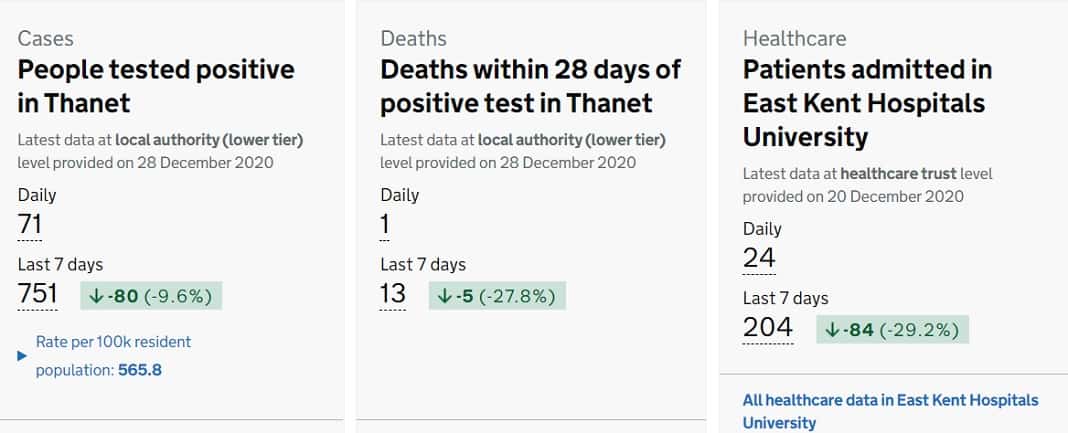
Today there has been one death recorded within 28 days of a positive test, making 13 losses in the last seven days and a total of 228 losses within 28 days of a positive test.
Covid-19 is mentioned on the death certificate but may not be the primary cause of death.
The latest R (reproduction) number for the healthcare region of South East is estimated at 1.2 to 1.4 with a daily infection growth rate range of +4% to +7% as of 24 December. The R rate is the average number of secondary infections produced by a single infected person,
The figures are updated daily, although there is some time lag on some statistics. They can be found on the government dashboard here and here
Hospital data
Data from East Kent Hospitals (via NHS England) shows there are 374 occupied Covid beds as of December 22 at the main sites (Margate, Ashford and Canterbury). This is up from 173 on November 30. Of those 27 mechanical ventilation beds are in use, up 10 from November 30. East Kent Hospitals Trust has recorded 752 covid related deaths to date (see footnote).
Tier restrictions
Thanet, along with the rest of Kent and Medway is in Tier 4 restrictions. This will be reviewed by government on December 30, Rumours that a Tier 5 could be brought in to try and reduce the covid spread are yet to be confirmed.
Tier 4 explained – what is closed, who you can meet, Christmas and where you can travel
Area Rate per 100,000
| Medway | 1,037.5 | |
| Dartford | 981.3 | |
| Gravesham | 974.4 | |
| Ashford | 842.9 | |
| Swale | 797.6 | |
| Maidstone | 766.5 | |
| Folkestone and Hythe | 720.4 | |
| Tonbridge and Malling | 704.5 | |
| Sevenoaks | 699.8 | |
| Dover | 650.1 | |
| Canterbury | 632.4 | |
| Thanet | 565.8 | |
| Tunbridge Wells | 535.7 |
Details of Covid attributed deaths data: NHS England and NHS Improvement publish the number of patients who have died in hospital and tested positive for COVID-19 in England. Since Tuesday 28 April, NHS England and NHS Improvement also reports the number of patient deaths where there has been no COVID-19 positive test result, but where COVID-19 is documented as a direct or underlying cause of death on part 1 or part 2 of the death certification process. This change has been introduced for deaths that occurred on 24 April and subsequently.
